Posts

Showing posts from 2016

Stock Alert and Chart Analysis: CMG

Image
Disclaimer   In these stock alert and chart analysis posts, I want to point out a security that has a very interesting chart and/or serious buzz in the social media sphere or mainstream media.   To help understand these alerts and chart analyses, consider checking out how I perform technical analysis  here   and how I trade breakouts   here .   Okay, back to the good stuff! Stock:  CMG, Chipotle Mexican Grill, Inc.

Stock Alert and Chart Analysis: TSLA

Image
Disclaimer   In these stock alert and chart analysis posts, I want to point out a security that has a very interesting chart and/or serious buzz in the social media sphere or mainstream media.   To help understand these alerts and chart analyses, consider checking out how I perform technical analysis  here   and how I trade breakouts   here .   Okay, back to the good stuff! Stock:  TSLA, Tesla Motors, Inc.

The Importance of Dividend Reinvestment Plans (DRIPs)

Image
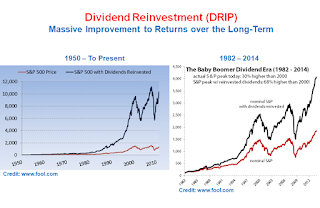
Disclaimer   TL;DR : Enrolling in DRIPs could dramatically increase the amount of $$ you have when you retire. Contact your broker to discuss DRIPs and the process to enroll in one. Some brokerages even allow you to enroll in DRIPs on their website.   Investing is hard enough due to the countless options available and the even more plentiful factors that influence the direction of those securities. In fact, most traders and investors will fail to beat the market .   So you have an important choice to make that has serious consequences to your retirement funds. Either bet on the market, dollar cost average, and re-evaluate when you near retirement, or try to time the market like you are more skilled than Wall Street fund managers and billionaires.   Taking your competitors into account if you do try to time the market, chances are you'll join the majority of people who lose disgusting amounts of money and vastly underperform those who simply dollar cost average an index fu

Stock Alert and Chart Analysis: UUP

Image
Disclaimer   In these stock alert and chart analysis posts, I want to point out a security that has a very interesting chart and/or serious buzz in the social media sphere or mainstream media.   To help understand these alerts and chart analyses, consider checking out how I perform technical analysis  here   and how I trade breakouts   here .   Okay, back to the good stuff!   First off, why is the US dollar important? Why should I care about the US dollar? Excellent questions and there are a number of reasons for both. Here are the most important reasons to keep an eye on the US dollar in my humble opinion: 1. The US dollar is by far the most used international reserve currency , more than double the Euro. 2. A gigantic portion of foreign debt is denominated in US dollars. 3. A strong dollar typically indicates a strong US economy and increased foreign capital investment in the United States. 4. A strong dollar typically provides downward pressure on inflation and commo

Stock Alert and Chart Analysis: EWZ

Image
Disclaimer Disclosure: I own EWZ in a retirement account.   In these stock alert and chart analysis posts, I want to point out a security that has a very interesting chart and/or serious buzz in the social media sphere or mainstream media.   To help understand these alerts and chart analyses, consider checking out how I perform technical analysis  here   and how I trade breakouts   here .   Okay, back to the good stuff! Stock: EWZ, iShares MSCI Brazil Capped. Long-term Weekly Chart Technical Analysis: EWZ is in a strong bull trend and is starting this week pretty bullish.  However, there is still 3 days of price action left in this weekly candle and EWZ is at resistance right now. EWZ could go so many ways right now so deference is paid to the current trend: bullish. Until that up-trendline starting in January is broken, EWZ is a long, not a short. Long-term Gameplan:

Stock Alert and Chart Analysis: GLD

Image
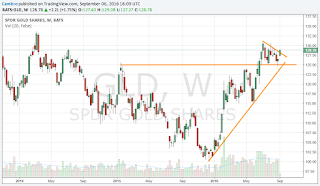
Disclaimer   In these stock alert and chart analysis posts, I want to highlight a security that is on fire for some reason. Either the security's chart looks amazing and/or social media is going nuts about it.   If you need a technical analysis refresher  click here , and if you want to learn how I trade breakouts   click here .   Okay, let's get to work! ( click here for the last GLD alert and technical analysis ) Stock: GLD, SPDR Gold Shares. Long-term Weekly Chart Technical Analysis: GLD is attempting to breakout above the descending triangle pattern, which is bullish. However, GLD still has 3 more days of price action to close out this week's candle and GLD is at resistance now. That means sellers have better odds than buyers, which is obviously bearish. So while this action may be a bullish pop to resistance, I'm cautiously bullish until I can verify the quality of this breakout by Friday. Long-term Gameplan:

Stock Alert and Chart Analysis: SPU

Image
Disclaimer   In these stock alert and chart analysis posts, I want to highlight a security that is on fire for some reason. Either the security's chart looks amazing and/or social media is going nuts about it.   If you need a technical analysis refresher  click here ,   and if you want to learn how I trade breakouts   click here .   Okay, let's get to work! Stock: SPU, SkyPeople Fruit Juice, Inc.

Stock Alert and Chart Analysis: GLD

Image
Disclaimer   In these stock alert and chart analysis posts, I want to highlight a security that is on fire for some reason. Either the security's chart looks amazing and/or social media is going nuts about it.   If you need a technical analysis refresher  click here ,   and if you want to learn how I trade breakouts   click here .   Okay, let's get to work! Stock: GLD, SPDR Gold Shares.

Stock Alert and Chart Analysis: TSLA

Image
Disclaimer   In these stock alert and chart analysis posts, I want to highlight a security that is on fire for some reason. Either the security's chart looks amazing and/or social media is going nuts about it.   If you need a technical analysis refresher  click here ,   and if you want to learn how I trade breakouts   click here .   Okay, let's get to work! Stock: TSLA, Tesla Motors, Inc.

Stock Alert and Chart Analysis: AMBA

Image
Disclaimer   In these stock alert and chart analysis posts, I want to highlight a security that is on fire for some reason. Either the security's chart looks amazing and/or social media is going nuts about it.   If you need a technical analysis refresher  click here ,   and if you want to learn how I trade breakouts   click here .   Okay, let's get to work! Stock: AMBA, Ambarella, Inc.

How to Find Stocks to Trade

Disclaimer   We all want to make money trading stocks. But there are thousands and thousands of stocks and ETFs you can trade. How do you find the ones to trade? You create a stock scan.   I've listed and organized my stock scans below. These scans cover every important aspect of the American economy as well as some foreign economies.   Reviewing scans enable me to find opportunities and to better understand what the market is thinking about various aspects of the global economy.   And if you're motivated, check out these posts that explain how I view the markets and how to trade them with the best risk/reward:  The Laws of Trading,   How to Trade,   and  Technical Analysis.   Stock scans:

The Performance Enhancing Drug (PED) of Trading

Disclaimer   So many of the top athletes in the world are testing positive for Performance Enhancing Drugs (PED). Pittsburgh Steelers’ linebacker James Harrison, Green Bay's Clay Matthews and Julius Peppers are under investigation for alleged use of performance enhancing drugs . Several athletes at the Rio Olympics were banned due to testing positive for PEDs. The entire Russian track and field and weight lifting teams were banned from competing in the Rio Olympics because of a state sponsored system of cheating was uncovered (including the involvement of the Russian version of the US CIA).  But why do these people feel the need to use PEDs despite the chances of being caught and punished?   These highly talented athletes cheat because the competition is fierce beyond any layman’s comprehension. Milliseconds mean the difference between getting a gold medal or getting a medal at all. Only the top performers succeed and are rewarded with medals, bonuses, and sponsorships. That

How to Trade Breakouts

Image
Disclaimer   In this post, I'm going to discuss the importance of breakouts and how to trade them, but first I want to discuss a few principles that are key to successful trading. Everything I do in trading is aimed at achieving one goal: A state of flow   Why is a flow state so important? For two reasons: 1) because it's essential to becoming consistently profitable at trading and 2) because it's essential to enjoying our short lives on this little planet in this small universe likely among many universes. The second reason probably sounds more controversial and provocative, and I hear you, just bear with me and let me know if you feel the same way after I reveal some compelling evidence.   First, let's go to the creator of the psychological concept of flow himself, Mihaly Csikszentmihalyi, and watch him explain what the concept of flow . In his TED talk, Mihaly (pronounced "me-hi" if I'm not mistaken) provides an example of someone achieving flo

How to Trade Simple Chart Patterns

Disclaimer   Before focusing on chart patterns, I recommend checking out the fundamental principles of the market.  It's very short and provides the "why" behind trading and investing.   Lastly, I recommend reading how to perform technical analysis . It's very simple and focuses on the best indicators.   Chart Patterns: How to Trade Breakouts How to Trade Bull and Bear Flags (aka channels) (in progress) How to Trade Rectangles (aka trading ranges)  (in progress) How to Trade Triangles  (in progress) How to Trade Wedges (in progress)

How to Perform F2G Technical Analysis

Image
Disclaimer I use technical analysis instead of fundamental analysis to take as much money from the markets as possible for several reasons. The most important reason is that a stock's price chart reveals areas where I have a higher probability of making money. A close second reason is that "Only price pays" - Brian Shannon aka @AlphaTrends . Everything else is noise in my opinion. Lakai (the most successful futures trader I follow)  and many other successful traders ( especially Tim Grittani ) taught me to keep things simple and master your trading niche. These lessons helped me crush the trading competition at work by turning $100k into $214k in just two weeks! The closest competitor to me turned $100k into $169k! But back to why technical analysis is so essential to extracting money from the markets. For example, Apple could crush earnings and for some reason the stock sells off. This happens to many stocks every quarter, year in and year out. Why not cut out the