Trade Recap - OTIV
I noticed OTIV once I got home from work and started researching tickers via traders on Twitter--check out my Resources page for the best traders to follow on Twitter--as well as through my scan on FinViz.com. So I first looked at the daily chart, and noticed it almost doubled from the day before.
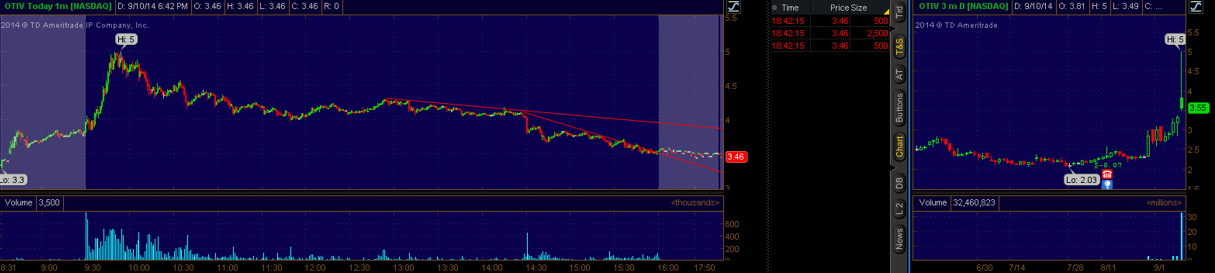


OTIV had a huge trading range on Sept. 10, 2014, but faded bigtime after the morning move. So I was short biased into the close because the intraday price action suggested people/the market do not support this excessive price appreciation. So I started watching around 2:00 pm and was looking for a lower high or double top after the $4 washout. I got it, shorted $3.74 with a risk at the previous resistance at $3.85, and a price target of $3.42--the reason behind this choice is because of a potential $3.50 washout and green-to-red (G/R) move:
OTIV slowly faded into the close, but $3.50 would not crack, so I covered part of my position at $3.61, and after a second failed attempt to crack, at $3.54.
Once again, I didn't leave any of my position overnight to see out my original trade plan/price target. And once again, my price target would be easily hit the following trading day:
So the lesson here is to STICK TO THE ORIGINAL TRADING PLAN lol. Sorry for the CAPS, it's not for you, it's for me :)
'Till next time,
Jory

Don´t beat yourself up. These low floaters can gap up 1$ for no reason, so I think you made the right decision not to hold o/n.
ReplyDeleteGood point. Some traders on Twitter suggest that hedge funds are targeting stocks like this, and that might be why we're seeing some of these stocks double, triple, or more in a single day.
ReplyDelete