Trade Recap - TROV
For my first trade recap--and forgive me if this is a crude first recap--let's look at TROV. Here is a one year daily chart of TROV. As you can see, TROV took off mid-August from the $3s up to almost $6. The last green daily bar before the red blow-off top was when this hit my scan.
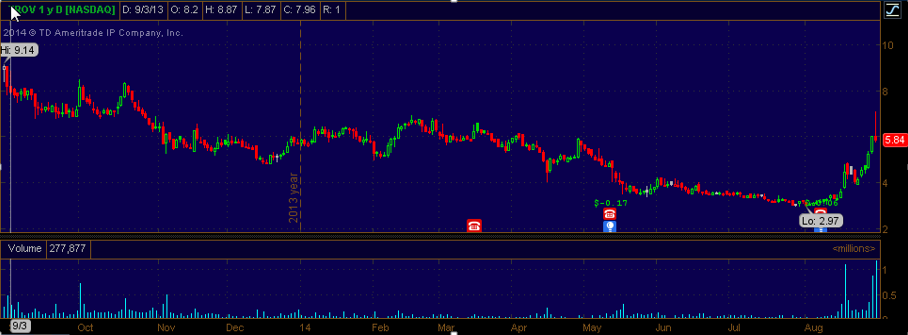
So from this daily chart, I noticed this ticker does not run--a runner is a stock that can spike big. I also felt historical resistance in the $7s would introduce some selling pressure. Taking these observations into account, I identified my ideal entry points as well as my stop loss and profit target.

I chose two entry points, $6.80 and $6.99 because I thought a $7 test and push wasn't that likely due to this ticker not being a runner. But I still felt comfortable if $7 did test and pushed a little.

My limit orders were hit, and the stock peaked at 7.10 thankfully, and well below my $7.30 stop loss. However, I didn't stick to my price target because of my emotions--specifically elation. It got the best of me. I couldn't believe how well the trade was going. So I took the money and ran, which may sound good, but that is poor trading. I should have taken half off, and let the other half ride to my original price target. TROV hit $5 only the next day! :*(

So from this daily chart, I noticed this ticker does not run--a runner is a stock that can spike big. I also felt historical resistance in the $7s would introduce some selling pressure. Taking these observations into account, I identified my ideal entry points as well as my stop loss and profit target.
I chose two entry points, $6.80 and $6.99 because I thought a $7 test and push wasn't that likely due to this ticker not being a runner. But I still felt comfortable if $7 did test and pushed a little.
My limit orders were hit, and the stock peaked at 7.10 thankfully, and well below my $7.30 stop loss. However, I didn't stick to my price target because of my emotions--specifically elation. It got the best of me. I couldn't believe how well the trade was going. So I took the money and ran, which may sound good, but that is poor trading. I should have taken half off, and let the other half ride to my original price target. TROV hit $5 only the next day! :*(

Comments
Post a Comment