How to Perform F2G Technical Analysis
Disclaimer
I use technical analysis instead of fundamental analysis to take as much money from the markets as possible for several reasons. The most important reason is that a stock's price chart reveals areas where I have a higher probability of making money. A close second reason is that "Only price pays" -Brian Shannon aka @AlphaTrends. Everything else is noise in my opinion. Lakai (the most successful futures trader I follow) and many other successful traders (especially Tim Grittani) taught me to keep things simple and master your trading niche. These lessons helped me crush the trading competition at work by turning $100k into $214k in just two weeks! The closest competitor to me turned $100k into $169k!
But back to why technical analysis is so essential to extracting money from the markets. For example, Apple could crush earnings and for some reason the stock sells off. This happens to many stocks every quarter, year in and year out. Why not cut out the noise, simplify your process, and focus on the wealth of valuable information on a price chart? Mike Bellafiore and Steven Spencer at SMB Capital taught me trading is hard enough and that the best traders focus on what works for them and to cut out what doesn't.
So how do you perform technical analysis of a price chart? There are many ways to perform technical analysis and there are hundreds of indicators you could choose to analyze. I prefer to focus on what a majority of market participants do because that increases the likelihood of my analysis being accurate. That's why I only focus on identifying support and resistance, simple chart patterns, and breakouts (something ModernRock emphasizes). Let me explain:
F2G Technical Analysis
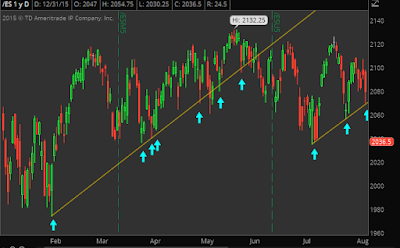
1. Support. Support is an area on a price chart where there's a higher probability of institutional buying and therefore a higher probability of prices rising after testing this area and a lower probability of prices falling. Support can be drawn on a price chart both horizontally and diagonally. Here's an example of support (yellow horizontal lines with blue arrows):

1a. Horizontal Support. As the name implies, support is identified with horizontal lines.
1b. Diagonal Support. As the name implies, support is identified with diagonal lines as well, here's an example:
2. Resistance. Resistance is an area on a price chart where there's a higher probability of institutional selling and therefore a higher probability of prices falling after testing this area and a lower probability of prices rising. Resistance can also be drawn on a price chart both horizontally and diagonally just like support. Here's an example of horizontal and diagonal resistance:

Some of you may be thinking "Dude you just redrew the horizontal support line around 2060, you lost me there..." If this was you, you are actually ahead of the game and noticed a fundamental principal of support and resistance. Once price breaks above resistance, as the /ES did in February (left side of the chart), that resistance became support in March (although at first it was rejected but by April and May it was solidified as support until July).
The opposite is true as well, once price falls below support that support level becomes resistance. And that's why in March /ES struggled at first to get back above that 2060 level.
Okay, now that you are familiar with support and resistance, let's move on to simple chart patterns that are formed from support and resistance lines.
3. Simple chart patterns. I only pay attention to a few chart patterns and those are bull and bear flags (aka channels), double bottoms and tops, triangles, and wedges. I think the key to drawing chart patterns is to draw what pattern you think most market participants see. If the chart pattern isn't clear, it's probably not clear to most people, so it's best to wait for more information instead of drawing a weird chart pattern and trading off of it.
3a. Bull and Bear Flags (Channels). A bull flag is a falling channel of price action inside a higher time frame up trend. Bull flags are essentially pullbacks in bull trends and you should favor the longer term trend until the price tells you otherwise. Here are some bull flags:

Bear flags are simply pullbacks in bear trends, so they are rising channels in higher time frame bear trends and therefore bearish. Here are some examples of bear flags:

3b. Double Bottoms and Tops. Double bottoms are bullish and double tops are bearish and even if a price gets tested more than twice, it will still behave like a double top or bottom as you'll see in this example:

3c. Triangles (Expanding, Symmetrical, Ascending, and Descending). Next up are triangles and there are four main types of triangles. Triangles are considered continuation patterns (except for expanding triangles which are reversal patterns) make sure you identify and respect the longer time frame trend if you notice a triangle on a price chart. Example time:
Expanding Triangles:

Symmetrical Triangles:

Ascending and Descending Triangles:

3d. Wedges (Rising and Falling). Wedges are converging trendlines and look similar to triangles. Rising wedges in bull trends are bearish reversal patterns while falling wedges in bear trends are bullish reversal patterns. Wedges can also be continuation patterns if they are falling in bull trends and rising in bear trends. Here are some examples:

4. Breakouts. Breakouts are very important because they signal either buyers or sellers are in control of the future price direction of the underlying security. If a breakout occurs below support (which I will now refer to as a breakdown), sellers are clearly in control of the future price of the underlying and therefore you have a higher probability of profit if you join these sellers.
Now I don't buy breakouts above resistance or sell breakdowns below support because most breakouts/downs fail. However, if price breaks out and closes strongly beyond a support or resistance level, I will either enter at the market with a partial position or wait for a pullback to the breakout level to enter with the new potential trend. Let's look at some break out examples:

Take notice that most breakouts failed, that's why I don't buy or sell them. However, if price closes strongly beyond a support or resistance level, I'll look for a retest of the breakout level to enter.
Okay, that about covers everything I do when performing technical analysis. In the next several posts I'll go into more detail about how to actually trade based on this analysis.
What are your thoughts about technical analysis? What indicators work for you? Do you find that more or less indicators improve your profitability?
Jory
I use technical analysis instead of fundamental analysis to take as much money from the markets as possible for several reasons. The most important reason is that a stock's price chart reveals areas where I have a higher probability of making money. A close second reason is that "Only price pays" -Brian Shannon aka @AlphaTrends. Everything else is noise in my opinion. Lakai (the most successful futures trader I follow) and many other successful traders (especially Tim Grittani) taught me to keep things simple and master your trading niche. These lessons helped me crush the trading competition at work by turning $100k into $214k in just two weeks! The closest competitor to me turned $100k into $169k!
But back to why technical analysis is so essential to extracting money from the markets. For example, Apple could crush earnings and for some reason the stock sells off. This happens to many stocks every quarter, year in and year out. Why not cut out the noise, simplify your process, and focus on the wealth of valuable information on a price chart? Mike Bellafiore and Steven Spencer at SMB Capital taught me trading is hard enough and that the best traders focus on what works for them and to cut out what doesn't.
So how do you perform technical analysis of a price chart? There are many ways to perform technical analysis and there are hundreds of indicators you could choose to analyze. I prefer to focus on what a majority of market participants do because that increases the likelihood of my analysis being accurate. That's why I only focus on identifying support and resistance, simple chart patterns, and breakouts (something ModernRock emphasizes). Let me explain:
F2G Technical Analysis
1. Support. Support is an area on a price chart where there's a higher probability of institutional buying and therefore a higher probability of prices rising after testing this area and a lower probability of prices falling. Support can be drawn on a price chart both horizontally and diagonally. Here's an example of support (yellow horizontal lines with blue arrows):

1a. Horizontal Support. As the name implies, support is identified with horizontal lines.
1b. Diagonal Support. As the name implies, support is identified with diagonal lines as well, here's an example:

2. Resistance. Resistance is an area on a price chart where there's a higher probability of institutional selling and therefore a higher probability of prices falling after testing this area and a lower probability of prices rising. Resistance can also be drawn on a price chart both horizontally and diagonally just like support. Here's an example of horizontal and diagonal resistance:

Some of you may be thinking "Dude you just redrew the horizontal support line around 2060, you lost me there..." If this was you, you are actually ahead of the game and noticed a fundamental principal of support and resistance. Once price breaks above resistance, as the /ES did in February (left side of the chart), that resistance became support in March (although at first it was rejected but by April and May it was solidified as support until July).
The opposite is true as well, once price falls below support that support level becomes resistance. And that's why in March /ES struggled at first to get back above that 2060 level.
Okay, now that you are familiar with support and resistance, let's move on to simple chart patterns that are formed from support and resistance lines.
3. Simple chart patterns. I only pay attention to a few chart patterns and those are bull and bear flags (aka channels), double bottoms and tops, triangles, and wedges. I think the key to drawing chart patterns is to draw what pattern you think most market participants see. If the chart pattern isn't clear, it's probably not clear to most people, so it's best to wait for more information instead of drawing a weird chart pattern and trading off of it.
3a. Bull and Bear Flags (Channels). A bull flag is a falling channel of price action inside a higher time frame up trend. Bull flags are essentially pullbacks in bull trends and you should favor the longer term trend until the price tells you otherwise. Here are some bull flags:

Bear flags are simply pullbacks in bear trends, so they are rising channels in higher time frame bear trends and therefore bearish. Here are some examples of bear flags:

3b. Double Bottoms and Tops. Double bottoms are bullish and double tops are bearish and even if a price gets tested more than twice, it will still behave like a double top or bottom as you'll see in this example:

3c. Triangles (Expanding, Symmetrical, Ascending, and Descending). Next up are triangles and there are four main types of triangles. Triangles are considered continuation patterns (except for expanding triangles which are reversal patterns) make sure you identify and respect the longer time frame trend if you notice a triangle on a price chart. Example time:
Expanding Triangles:

Symmetrical Triangles:

Ascending and Descending Triangles:

3d. Wedges (Rising and Falling). Wedges are converging trendlines and look similar to triangles. Rising wedges in bull trends are bearish reversal patterns while falling wedges in bear trends are bullish reversal patterns. Wedges can also be continuation patterns if they are falling in bull trends and rising in bear trends. Here are some examples:

4. Breakouts. Breakouts are very important because they signal either buyers or sellers are in control of the future price direction of the underlying security. If a breakout occurs below support (which I will now refer to as a breakdown), sellers are clearly in control of the future price of the underlying and therefore you have a higher probability of profit if you join these sellers.
Now I don't buy breakouts above resistance or sell breakdowns below support because most breakouts/downs fail. However, if price breaks out and closes strongly beyond a support or resistance level, I will either enter at the market with a partial position or wait for a pullback to the breakout level to enter with the new potential trend. Let's look at some break out examples:

Take notice that most breakouts failed, that's why I don't buy or sell them. However, if price closes strongly beyond a support or resistance level, I'll look for a retest of the breakout level to enter.
Okay, that about covers everything I do when performing technical analysis. In the next several posts I'll go into more detail about how to actually trade based on this analysis.
What are your thoughts about technical analysis? What indicators work for you? Do you find that more or less indicators improve your profitability?
Jory
Helpful. I'm learning gradually and this helped answer some terminology questions I had. In general, which patterns do you trade the most and have most success with? How much does overall market sentiment weight into the securities you trade?
ReplyDeleteIt's more about seeing a clear pattern first, then trading it because everyone knows how to trade a clear pattern. The hard part is not trading when you don't see a clear pattern. This is my personal biggest challenge because I feel pressured to see a clear pattern in every chart, even if there isn't one. TLDR: Sit on your hands and never trade UNTIL you see a clear chart pattern.
ReplyDelete