Stock Alert and Chart Analysis: GLD
Disclaimer
In these stock alert and chart analysis posts, I want to highlight a security that is on fire for some reason. Either the security's chart looks amazing and/or social media is going nuts about it.
If you need a technical analysis refresher click here, and if you want to learn how I trade breakouts click here.
Okay, let's get to work!
Stock: GLD, SPDR Gold Shares.
Long-term Weekly Chart Technical Analysis:
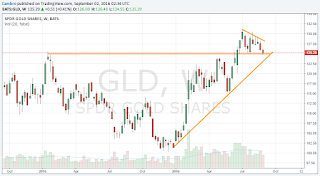
GLD is holding a very important support level right now near the bottom of a triangle in addition to resistance turned support from Jan 2015. GLD could easily drop a bit more to meet the bull trendline since Dec 2015.
Long-term Weekly Chart Gameplan:
GLD is testing multi-month support, if it fails, it's going to at least the bull trendline since last year. So bullish people on GLD could buy now with a tight stop just below this support betting this triangle is the important pattern.
Short-term Daily Chart Technical Analysis:

Short-term Daily Chart Gameplan:
GLD bouncing already at key MTF (multiple timeframe) support. This chart looks to be forming a descending triangle. We'll see though as tomorrow (Friday) is extremely important. But longs have the advantage at least short term for a bounce.
What are your thoughts on GLD? Let's discuss it in the comments below. Many minds are always better than one!
Jory
In these stock alert and chart analysis posts, I want to highlight a security that is on fire for some reason. Either the security's chart looks amazing and/or social media is going nuts about it.
If you need a technical analysis refresher click here, and if you want to learn how I trade breakouts click here.
Okay, let's get to work!
Stock: GLD, SPDR Gold Shares.
Long-term Weekly Chart Technical Analysis:

Long-term Weekly Chart Gameplan:
GLD is testing multi-month support, if it fails, it's going to at least the bull trendline since last year. So bullish people on GLD could buy now with a tight stop just below this support betting this triangle is the important pattern.
Short-term Daily Chart Technical Analysis:

GLD bouncing already at key MTF (multiple timeframe) support. This chart looks to be forming a descending triangle. We'll see though as tomorrow (Friday) is extremely important. But longs have the advantage at least short term for a bounce.
What are your thoughts on GLD? Let's discuss it in the comments below. Many minds are always better than one!
Jory

Comments
Post a Comment