Posts

Showing posts from 2014

Trade Recap - ISNS

Image
Here was the daily chart of ISNS going into Dec. 5th: ISNS had been consolidating in a trading range since late Sept. and was starting to perk up, so I was in long biased mode. When I pulled up the intraday chart, it had already broken out above key resistance at $3.50. So I looked for a test of major support or a downtrend line break to enter long. Here is how I traded ISNS (blue arrow = stop, green arrow = long, red arrow = sell):

Trade Recap - IDRA

Image
Here was the daily chart for IDRA going into Dec. 5th: IDRA was up over a double since the middle of October, with most of that move coming in just the last few days. This was clearly an over-extended (OE) chart so I was short biased going into the day, and looking for major trend breaks to strike. Don't get me wrong, I know OE charts can keep on going, so I know to always have a plan before getting into a trade. Here was IDRA's intraday chart and how I traded it (FYI, blue arrow = stop, red arrow = short, green arrow = cover):

Never Give Up

Trading is perhaps one of the most difficult endeavors on the planet. So unless one has a true passion for trading and an ironclad, unwavering, and resilient calling to trading, he or she will likely face the spectre of defeat. Here are some thoughts from the wise to keep you going if trading truly is your calling. Just remember, Never Give Up! “When you get into a tight place and everything goes against you, till it seems as though you could not hang on a minute longer, never give up then, for that is just the place and time that the tide will turn.” -Harriet Beecher Stowe “Many of life's failures are people who did not realize how close they were to success when they gave up.” -Thomas Edison “Never give up on something that you can’t go a day without thinking about.” -Winston Churchill

Trade Recap - ONCY

Image
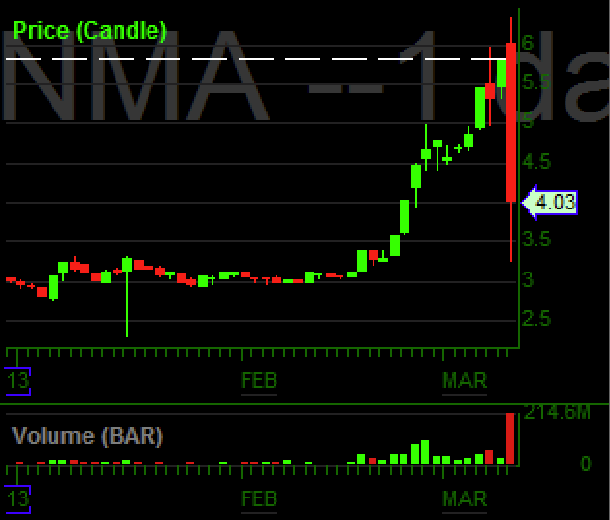
On Friday, I pulled up my FinViz scan around lunch time and noticed this beautiful overextended daily chart of ONCY: ONCY had doubled in just a few days and broke through the key magnet of $1. Therefore, I was short-biased on any trend break but wouldn't hesitate to go long if ONCY continued to uptrend and breakout in the afternoon. Why? Because this daily chart attracts the most short sellers, and if ONCY didn't breakdown, it likely would squeeze some shorts and breakout, or at least re-test HODs. I pulled up the intraday chart, noticed ONCY was in a nice unptrend, drew trend lines, and waited for the uptrend line crack to short. ONCY cracked the uptrend line fairly quickly, and so I shorted $1.03, risking to $1.05 (i.e., if $1.05 didn't become resistance, I'd get out). ONCY washed out immediately sub-$1 and I covered half into that washout. ONCY popped back up to $1.05, which spooked me, so I covered the rest, despite the fact $1.05 became resistance, wh

Words of Wisdom

Image
I thought I'd share some important words of wisdom from the professionals. These quotes help keep me focused, motivated, and determined to succeed. I hope you find them useful too. Take care, Jory

Trade Recap - IBIO

Image
On Friday, I saw a tweet from @BlinkX90 regarding IBIO: $IBIO EXCLUSIVE-US GOVERNMENT ASKS EMERGENCY DRUG LABS TO PLAN FOR PRODUCTION OF EXPERIMENTAL EBOLA DRUG ZMAPP Reuters — Blink (@BlinkX90) October 17, 2014 So I pulled up the daily chart and noticed IBIO had recently ran from about 70 cents to ~$2.70 in three days! Then it pulled back hard, then started a dead-cat bounce: The daily chart told me shorts were (and probably still were) interested in this stock. Moreover, IB didn't have any shares to short IBIO--proof shorts were already pilled into IBIO. Therefore, I was long biased and the news that the US Government was warning makers of IBIO's Ebola drug ZMAPP to plan for production further supported a long bias. I pulled up the intraday chart and noticed traders had already began reacting to the news and were bidding up the stock around 2:30 pm:

The Best Brokers for Traders

Interactive Brokers Cheap fees/commissions--$.005 per share--but requires $10k to open an account.  Great for live trading practice using tiny position size (10 to 100 shares etc.) without risking a lot of capital.  This is vital because the trader learning curve is steep and littered with drawdowns. Therefore, if you refuse to paper trade to learn, IB is a great choice for live trading to increase the amount of trading practice while keeping risk minimal/small. Great borrows for shorting stocks. Think or Swim by TD Ameritrade Pricey at $9.99 a trade. Paper trade feature great for practicing.  Excellent charting program used by many pros. Easy to customize platform with plenty of YouTube how-to videos. OnDemand feature lets you simulate a trading day for any stock going back about 5 years. This feature is invaluable for developing traders. SpeedTrader Pro Excellent commissions--$.0025 per share--but requires $25k to open an account. Great for live trading practice us

The Best Blog Posts for Traders

In no particular order: Why Most Traders Lose Money and Why the Market Requires It How Goal Setting Helps Performance Cultivating Self-Control by Enhancing Working Memory What Makes an Expert? Three Surprising Research Conclusions The Greatest Mistake Traders Make This Is Why We Can't Have Nice Things Why 90% of the Mental Game is Your Trading Self-Efficacy, Physical Exercise, and Goal Attainment How to Stop Comparing Yourself to Others (and Start Empowering Yourself) 11 Important Hedge Fund Terms To Know The Best Investments In 2014 (Investor flows) 94 Lessons On How To Trade Penny Stocks From The #1 Trader Out Of 60,000+ How To Make $200,000 In One Day With Penny Stocks: A 3,000 Word Detailed Lesson Traders & Investors: YOU NEED THIS NOW (Pre-Promo) Technical Analysis Of Your Own Patterns Cramer's Twenty-five Rules for Investing The world’s greatest stock picker? 10 commandments for  teachers  everyone with a brain Mapping Investor Behavior Is Inside

The Best Books for Traders

The Best Books for Traders: The Daily Trading Coach: 101 Lessons for Becoming Your Own Trading Psychologist by Dr. Brett Steenbarger The PlayBook: An Inside Look at How to Think Like a Professional Trader by Mike Bellafiore Any of Trading Price Action books by Al Brooks Any of the Market Wizards books by Jack D. Schwager Trade Like a Casino by Richard L. Weissman Critical thinking, problem solving, and human behavior: Asking the Right Questions: A Guide to Critical Thinking by M. Neil Browne and Stuart M. Keeley The Thinker's Toolkit: 14 Powerful Techniques for Problem Solving by former CIA Analyst Morgan D. Jones The ONE Thing by Gary W. Keller and Jay Papasan. Persuasion and Influence For Dummies by Elizabeth Kuhnke

The Best Videos for Traders

The best trading related videos: Improving Trader Performance Al Brooks - Best Price Action Al Brooks - Trading Channels Position Sizing Strategies. Control Your Risk When Trading Trading Mistakes Trading Coach Shares Views on Three Common Problems for Traders The best process improvement videos: How to Live Before You Die The Key to Success? Grit. The surprising science of willpower How smart can we get? (Journaling emotions around 41:00) On Being Wrong How to Make Stress Your Friend Forget big change, start with a tiny habit The Psychology of Human Misjudgment How Great Leaders Inspire Action Why Leaders Eat Last Five Tips for Graduates Your Body Language Shapes Who You Are THUNK - 41. How Emotions Make You *More* Rational Hans Rosling and Ola Rosling: How not to be ignorant about the world The best scientific explanations of human/trading behavior videos: The Human Brain Documentary Limbic System Autonomic Nervous System (ANS) and Physiologic Marker

The Best Blogs for Traders

Trade the Ticker (@kroyrunner89) TraderFeed (@steendbab) Personal History, Inspiration, Humor, Trading Lessons and Food for Thought (@EpicaCapital) Nate's Blog (@InvestorsLive) Al's Blog (@AlBrooksPA) Abnormal Returns Nikkos' Trading Blog (@Nikkorico_) Dash of Insight

The Best Traders to Follow on Twitter

  In no particular order: Traderstewie - @traderstewie Brian Shannon - @alphatrends Modern Rock - @modern_rock and @mrockrulez Scott Redler - @RedDogT3 Urban Carmel - @ukarlewitz Irrelevant Investor - @michaelbatnick Jack Damn - @JackDamn Steven Spencer - @sspencer_smb Peter Brandt - @PeterLBrandt Helene Meisler - @hmeisler Tim Parker - @autumnalcity87 Brett Steenbarger - @steenbab The Daytrade™ - @d4ytrad3 Dan Zanger - @danzanger Sunrise Trader - @SunriseTrader Greg - @lx21 Chris Carey - @sharesleuth Lakai - @_lakai_ Phil Goedeker - @OzarkTrades Nikkorico - @Nikkorico_ D K1 - @canuck2usa Tim Grittani - @kroyrunner89 Brandon Garretson - @crawfish_poboy Eric Wood - @elkwood66 Al Brooks - @AlBrooksPA Veritas - @VeritasGreen Mile High Trader - @Mile_HighTrades Notable Calls - @thenotablecalls Shane Blackmon - @shaneblackmon Blink - @BlinkX90 Marc Lehman - @markflowchatter Adamn Feuerstein - @adamfeuerstein TradeHawk - @TradeHawk MuddyWatersResearch - @m

The Best Trading Gurus

The Best Trading Gurus Lakai - www.tradeitdontdateit.com ( @_lakai_ on Twitter) The best futures trader I follow. The best price action trader I follow. Cuts out all the BS indicators and focuses on pure support and resistance to make loads of dough in the markets. Al Brooks - www.brookspriceaction.com  ( @AlBrooksPA on Twitter) Exceptional trader with almost 30 years of experience trading several markets.  Al cuts out all the BS technical indicators and fundamentals and focuses on pure price action. After all, HFT algorithms control the markets these days and they trade mathematically, which leaves discernible patterns in the price action. Check out his books, chat room, and YouTube channel . Dan Zanger -  www.chartpattern.com  ( @DanZanger on Twitter) Dan is the world record holder for the largest percent change for a personal portfolio for a 12-month period of time and an 18-month period of time in the history of the stock market. Specializes in swing trading st

Trade Recap - APT

Image
Here was the daily chart for APT on Oct. 9th: In the last two months alone, APT had gone from about $2 to $5! Very impressive price appreciation there. So this popped up on my FinViz scan and compelled me to pull up the intraday chart. I was short biased because the stock had been on a tear and the odds were in favor of at least a short-term pullback. I drew trendlines and decided to wait for the stock to tell me to short--i.e., break an up-trendline and subsequent lower highs or a double top. I got my chance fairly quickly at ~$4.60, but I hesitated. Instead, I shorted after the major up-trendline failed and began acting as a top at ~$4.45. I set my stop at previous resistance and set two price targets (one short term and one long term).

Trade Recap - LAKE

Image
Here was the daily chart for LAKE on Oct. 2nd: So I pulled up this daily chart after seeing my twitter traffic as well as having watching this stock the day before on its first massive volume day. LAKE was overextended and trading in the red all day so I was short biased because the first red day can be deathly for an overextended stock, but I also wanted to wait to short until it broke any major up-trendline. So I pulled up the intraday chart, drew my trendlines, and waited for the best opportunity to strike. I got my chances within minutes of getting home from work--around 2:45 pm. I shorted after the up-trendline was broken AND after the first bounce/retest of that trendline at $8.64. I also felt conviction because TKMR started pulling too. I set my stop at -18 cents and two price targets: +42 cents and +62 cents: So LAKE acted as predicted and began to fade. I got a really nice washout at $8.50 and $8.40, but my first price target at $8.22 wasn't hit. I started to

Trade Recap - GPRO

Image
If you haven't heard about GPRO, you've probably been living under a rock lately lol. GPRO has been on a complete tear since its IPO back in June. Here is a daily chart from Sept. 25th: So this puppy had gone from ~$30 to ~$80--almost a triple in just a few months! I wasn't trying to short this at any point until I saw the parabolic move from $65 to $80--most likely a result of over-zealous/uncompromising shorts. On the 25th, GPRO had a shake out over/under $80, and I thought I would enter short here after most of the shorts were panicked out, and no sane investor would buy at these levels--or would they? I thought it unlikely. I shorted a tiny 10 shares in the afternoon at $80.50 after it broke its uptrend line. I told myself to use tiny shares and a wide stop because I "knew" this stock would have to correct/retrace, so I would add in more shares short if it moved higher. I set my stop at an asinine level, $92.10:

How To Overcome the Most Stressful Trading Situations

As a newb trader analyzing his past trades, I've noticed that I struggle with sticking to my trading plans/rules and overcoming stressful trading situations. I realize that I'm not alone with this problem, and so I decided to do some research that might help me and other traders identify ways to improve upon these weaknesses. This post is about what I've discovered. First, I wanted to turn to professionals for insights on overcoming these problems. This is where I discovered what the Navy SEALs do to overcome stressful situations : “Information from our senses [visual, auditory, etc.] reach the amygdala almost twice as fast as the frontal lobes." The amygdala is the main culprit for our fight or flight response and the frontal lobes are responsible for rational thought and problem solving. "The speed of the different brain signals means that, unless we instinctively know how to react to a potential threat, we may freeze in fear waiting for the frontal lob

Trade Recap - LAKE

Image
Here is a daily chart of LAKE on Oct. 1st. As you can see, this puppy was up big time and on serious volume. Apparently this company makes HAZMAT suits--and with Ebola being diagnosed in the US--the market felt this company may benefit because there is no tested vaccine and the one that supposedly works has run out. Anyway, I could care less; I'm a technical trader. So I pulled up the intraday chart after coming home from work and noticed LAKE started a small re-tracement towards its uptrend line.

Trade Recap - RADA

Image
Here was the daily chart for RADA on September 29th: RADA had huge range and volume that day and this was the first decent green candle after a huge sell-off from the $6s. This is one of my preferred setups on a daily chart--a beat chart ( check out my trading rules here ). So I pulled up the intraday chart and noticed RADA had been selling off since its failure to break above $4 around noon. Here was my thought process:

Why Trading Stocks is the Best Therapy in the World

I’m writing this post in an effort to condense numerous lessons I've learned from several different sources I've studied in the course of trying to become a better trader. Trading options and futures is a zero sum game--there is a winner for every loser. Equity trading isn't much better. Moreover, most traders fail (you can also consult the Google for several research papers that further support this point). Failure invokes powerful emotions and memories, that, as a result, invoke future behavior that tries to avoid failure at all costs. Furthermore, fear and greed become more commonplace--which insidiously undermines traders by influencing them to avoid the very trading rules that gave them an edge in the market in the first place. Any edge in the market can be easily and effortlessly undone by emotion.

Trade Recap - ALKM

Image
This was my worst trade since coming back to trading in August. So let's see why. First off, I heard about the OTC ticker ALKM being a StockTips pump and dump from  @StockRealist via Twitter--as well as via his blog here --around early September. My goal was to put ALKM on my watchlist and watch for any over-extension on the daily chart. If that happened, I would begin putting in IB good-til-cancel (GTC) orders to short the stock for a couple reasons: 1) It's very difficult to find borrows on these stocks and IB GTC orders sometimes get filled pre-market; 2) Odds were this POS was going to collapse, and it was only a matter of time. On September 5th, everyone and their brother thought ALKM was the next StockTips pick despite StockTips not revealing their pick. As a result, the buying came in fast and the stock went nuts--going from around .10 to over .50 in a single day: However, it turns out that StockTips delayed their pick that night or so. Well the next d

Trade Recap - ASTY UPDATE

Image
So here is a quick update post regarding my ASTY trade a few days ago . Turns out that ASTY was a POS like I thought and it did breakdown out of that consolidation area finally. It broke down so hard that it broke $4.50--basically down 40% from my short. :) One takeaway from this stock is that I forgot to keep tabs on it. There have been several plays lately that have taken my attention. And once a stock starts consolidating, I tend to avoid the stock and look elsewhere for better opportunities. I'm thinking that I should at least revisit stocks that I stopped out on in order to see if my original hypothesis is finally playing out. Actually, probably more often than not, I'm early on a trade. So I really should revisit stocks that I stopped out on and be ready to strike again because the stocks I short, especially OTC piece of crap stocks like ASTY, tend to behave as I predicted in the long run, and the rewards are huge with these type of stocks. Anyhoo, I'm not u

My Trading Rules

Ask the best traders out there about the importance of trading rules and they'll unanimously agree that every trader needs well thought out trading rules. Trading rules should be crafted to fit your trading style and should emphasize trading the best setups, risk management, trade management, and most importantly, systematic trading. Systematic trading is the most effective antidote to emotional/unprofitable trading. If you know exactly what to do before you get into a trade, your emotions have a funny tendency of conceding defeat, "Well I want to freak out now, but I think he/she's got this trade under control." And then you evolve into a focused trading machine trained to take money from the volatile market. Here are my trading rules to give you an idea: 1) Focus on great multiple time frame (MTF) chart patterns, then set a game plan. 2) Identify intraday chart patterns in relation to MTF chart patterns and react. 3) Identify the best with trend entry loc

Structured Trade Analysis

Image
I decided to download my trading data from my broker and analyze my trades in response to some of the lessons I've learned in Dr. Steenbarger's book, The Daily Trading Coach . I took the data, put it into Excel, and created some charts. So let's go over my period of performance covering 8/1/2014 to 09/09/14: My initial reaction is wow, displaying raw trading data visually can really simplify the process of analyzing past trades. Analyzing my past trades as well as the impact different market variables have on these trades are essential to understanding my strengths and weaknesses as a trader. So let's focus on my best and worst trades for this period.

Trade Recap - ASTY

Image
Here is a daily chart of ASTY, an OTC POS, as of Sept. 12, 2014: The daily chart shows ASTY has more than doubled off the consolidation in the $3s; however, it has now started to consolidate at these new levels. With this in mind, I was short biased, but I didn't have much conviction in the trade because of the new consolidation taking place. Next I pulled up this fugly beast's intraday chart at around 2 pm that Friday:

Disclaimer

    This blog is my journal for information and self-development purposes only. Use of this blog in any way constitutes your full understanding of and compliance with this disclaimer.     I use this blog as a centralized database for all the research and resources I've come across over the last 20 years. This blog serves as a journal where I discuss my thoughts. I try to document my thoughts and feelings to help me learn faster. I also analyze my performance and adherence to my core principles. Blogging helps me learn and adapt very quickly.     My posts are in no way meant to be construed as a suggestion, hot tip, or pressure to purchase or sell any security. The use of this blog constitutes your full understanding of and compliance with this disclaimer.     If you have any questions, please ask them in the comment section below. Thanks for reading this disclaimer and welcome to the Furu to Guru blog! Jory

Trade Recap - GIGA

Image
After coming home from work, I noticed several top traders on Twitter talking about GIGA. So I pulled up the daily chart and noticed GIGA was up big after a long period of sideways consolidation. Then I looked at the intraday chart. It was very nice and was up-trending perfectly. So I was looking at the chart around 3:00 pm, and was looking for an entry at the next pullback with a risk at previous support around $2.47. I did get a little pullback and entered at $2.64 with a price target of....nothing. I had no price target, which is really poor trading in hindsight. However, I did at least note the $3 magnet:

Trade Recap - OTIV

Image
I noticed OTIV once I got home from work and started researching tickers via traders on Twitter-- check out my Resources page for the best traders to follow on Twitter--as well as through  my scan on FinViz.com . So I first looked at the daily chart, and noticed it almost doubled from the day before. OTIV had a huge trading range on Sept. 10, 2014, but faded bigtime after the morning move. So I was short biased into the close because the intraday price action suggested people/the market do not support this excessive price appreciation. So I started watching around 2:00 pm and was looking for a lower high or double top after the $4 washout. I got it, shorted $3.74 with a risk at the previous resistance at $3.85, and a price target of $3.42--the reason behind this choice is because of a potential $3.50 washout and green-to-red (G/R) move:

Trade Recap - GALT

Image
So yesterday, Sept. 12, 2014, I was watching a few overextended stocks and a few beat stocks that may bounce soon. Then I saw this tweet: $GALT moving on 8k, In discusssions with Large Pharmaceutical companies, pg 23 http://t.co/TWgj8554aV — Blink (@BlinkX90) September 12, 2014 After a quick glance at the daily chart for GALT, I noticed the stock was beat, but recently started an uptrend. Moreover, the stock was nearing a breakout at ~$6.60. Next, I took a quick glance at the intraday chart and noticed a strong chart that already was nearing $6.60 when I first glanced at it. I think I pulled up GALT at around 3:15 pm and at ~$6.40.

Key Lessons After Coming Back to Trading

Image
I've consistently executed good trades since coming back to trading in early August 2014. Here is a snapshot of my cumulative return so far: That's a pretty decent stair-step-like progress chart if I do say so myself! I'm not used to this type of steady progress, so it's quite refreshing. In fact, I've never had such a good positive-to-negative period ratio--I.E., green trades versus red trades:

Breaking Down My Worst Trade Ever

Image
  Back in March 2014, I had the opportunity of a lifetime. I witnessed the over-extension of one of the most traded OTC stocks in the market, FNMA.   It was clear this was going to collapse soon and I was totally prepared. So how did I snatch defeat from the jaws of victory? For several reasons.

Trade Recap - SGOC

Image
Here is a one year daily chart for SGOC. This hit my scan on the big green candle with massive volume in late August. I noticed this stock had ran hard/spiked in the past. So I was not in a short mentality but a long mentality. I decided to look for a weak open entry, then hopefully a red to green (R/G) move and continued momentum. So I set my first entry price at a support level during the previous big green candle day around $2.67. And for some reason I felt an additional entry at major support from the previous day at around $2.50 would be a good add.

Resources Mega List

Knowledge is power and with power you can achieve your wildest dreams! But to acquire this knowledge it takes passion, practice, discipline, and an open mind at all time. Here's my Mega List of Resources on everything trading and trading psychology! The #1 Goal that Leads to Trading Success What I learned over the years was that, despite what everyone in the trading community tells you, there's really only one major goal in trading, and that everything else is either secondary or a waste of your time. And if you achieved this one goal, you could make it into the top 5-10% of successful traders after climbing out of the losing 90-95% of traders. Trading 101 How we make money trading, plain and simple. Fundamental Principals of F2G Trading The "Why" behind F2G trading and what we believe. How to Master Trading Think TAPER (Technical Analysis, Planning, Execution, and Review). #1 key here is to plan your trade and trade your plan. The F2G Trading System Ch

Adjustments to My Learning Process

After watching a very helpful video by trading coach, Dr. Brett Steenbarger,  http://youtu.be/2LKW1fbDNOo , I've decided to structure how I track my trading performance and how to use that information to make incremental improvements to my trading using the following outline: Practice decision making (performance) Identifying and taking advantage of opportunity in the market Measurement of results Outcome feedback (how well I'm doing) Process feedback (what I'm doing well, what I'm not doing well) Use the feedback to set achievable goals and try to improve future performance Vividly imagine great trades, what I did, and how it made me feel Vividly imagine poor trades, what I did, and how it made me feel Simple enough, but we'll see how it goes! Jory

Trade Recap - TROV

Image
For my first trade recap--and forgive me if this is a crude first recap--let's look at TROV. Here is a one year daily chart of TROV. As you can see, TROV took off mid-August from the $3s up to almost $6. The last green daily bar before the red blow-off top was when this hit my scan. So from this daily chart, I noticed this ticker does not run--a runner is a stock that can spike big. I also felt historical resistance in the $7s would introduce some selling pressure. Taking these observations into account, I identified my ideal entry points as well as my stop loss and profit target.

My Trading Strategy

Before I discuss my strategy, I'd like to start with an important quote that's relevant to aspiring traders: "Many of life's failures are men who did not realize how close they were to success when they gave up." –Thomas Edison Perseverance is one of the most important personal qualities of a successful trader. Its importance is backed up by research, which you can learn more while not boring yourself to death in this great TED Talk by Angela Duckworth:  http://www.ted.com/talks/angela_lee_duckworth_the_key_to_success_grit Okay, now for my strategy. I try to keep it simple stupid (KISS):

My Ultimate Goals

Thank you for visiting the Furu to Guru blog. I plan to use this blog mainly as as trading journal and somewhere I can put my thoughts/reasoning behind my trades into words and pictures. This will help me more easily identify what I'm good at, what I'm not so good at, and help me focus on and develop my strengths as a day and swing trader. My ultimate goals in the market provide me a framework and guide to my desired self. They help give me clarity and guidance to ensure my overall well-being, not just as a trader. Here are mine: